The Speed and Classification report displays speed data and vehicle classification data captured in a traffic study. To generate a Speed and Classification Report:
- Go to Reports in the left frame.
- Select Speed and Classification report.
- Select a date range.
- Select the locations for the study.
- Select the Sites from a map.
- Select the devices from the sites.
- Name the report then click Finish.
The Speed and Classification report will be generated.
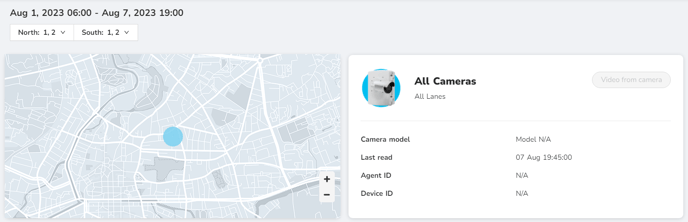
The top of the report will have the map of the devices selected for the report, and camera information.
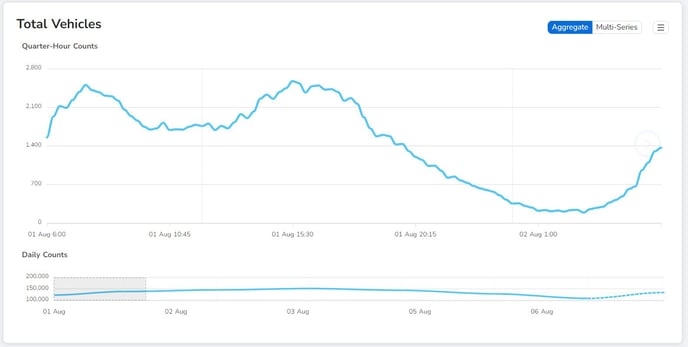
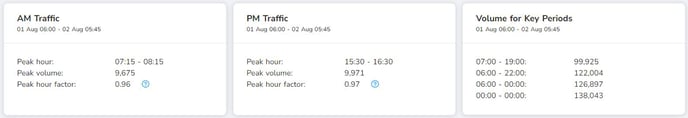
The Total Vehicles graph displays the vehicle counts by quarter hour and per day with AM traffic, PM traffic, and Volume for Key Periods detailed just below. The data may be viewed in Aggregate or Multi-Series views. This section can also be downloaded to a .CSV file.
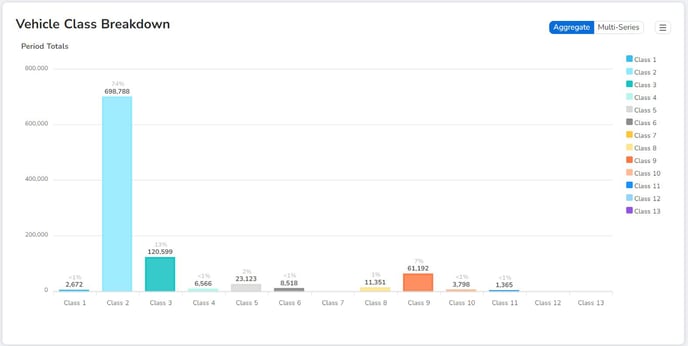
The Vehicle Class Breakdown graph displays the amount o of vehicles per each of the DOT’s 13 classifications for that period. The data may be viewed in Aggregate or Multi-Series views. This section can also be downloaded to a .CSV file.
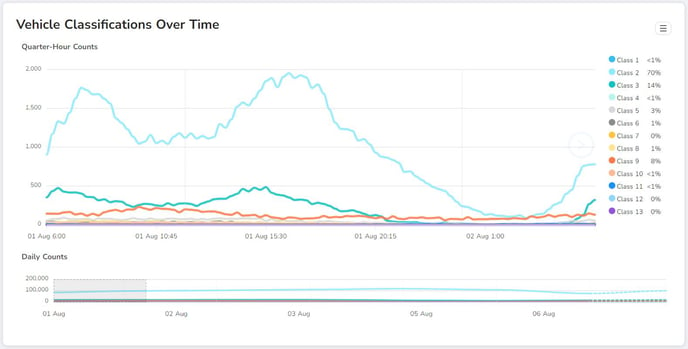
The Vehicle Classifications Over Time graph displays the DOT’s 13 classifications per class per quarter hour count and per daily count. This section can also be downloaded to a .CSV file.
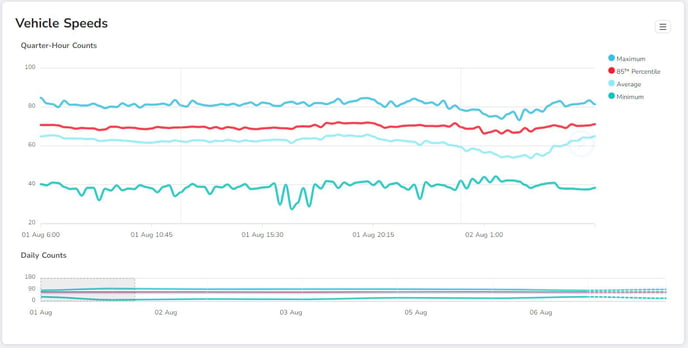
The Vehicle Speeds graph displays the four speed classifications per class per quarter hour count and per daily count. Those speed classifications are: maximum, 85th percentile, average, and minimum. This section can also be downloaded to a .CSV file.
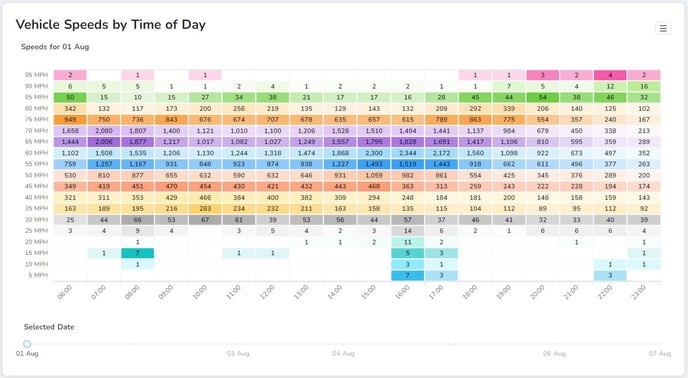
The Vehicle Speeds by Time of Day graph displays the speed per miles per hour by hour of the day. To view more dates, slide the Selected Date to the next day. This section can also be downloaded to a .CSV file.