Crash prediction information can be accessed in two ways.
- Crash Risk Layer: Crash predictions will appear in real time with road segments highlighted on the live map.
- Smart Forecasts Panel: Predicted high-risk areas will be listed for the next 24 hours.
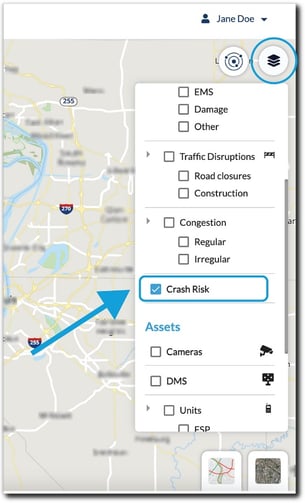
To turn on the Crash Risk Layer, follow these steps:
- Open the layer table on the right side of your screen
- Select the box labeled "Crash Risk."
- You can also choose to select to only see 'active' or 'predicted' car crashes by selecting those boxes.
- You can also choose to select to only see 'active' or 'predicted' car crashes by selecting those boxes.
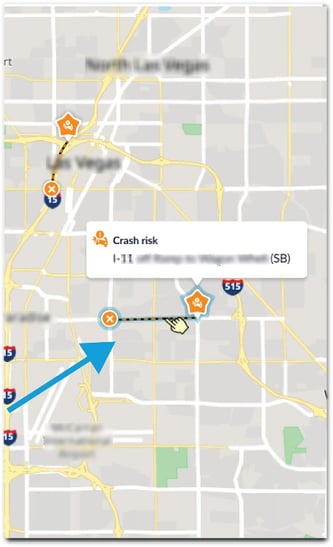
- If any road segments are found by the system to be at higher crash risk right now, they will appear with an orange icon on the live map.
To open the Smart Forecasts Panel, follow these steps:
- Click on the icon to the left of the layers icon.
- A panel will appear titled "Smart Forecasts," displaying a timeline of all predicted incidents over the next 24 hours.
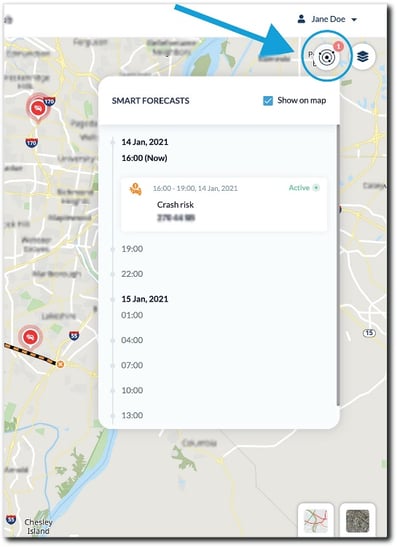
- Make sure that the “Show on Map” box is checked to show the live at-risk road segments on the map.
- You can also select to see 'active', 'forecasted', or 'all' crash predictions by clicking on the dropdown and making your selection.
Note: A red number on the Smart Forecasts panel represents the number of crash risks that are currently active.