To generate and view a, Electric Charging Planning report:
Login to Rekor Discover.
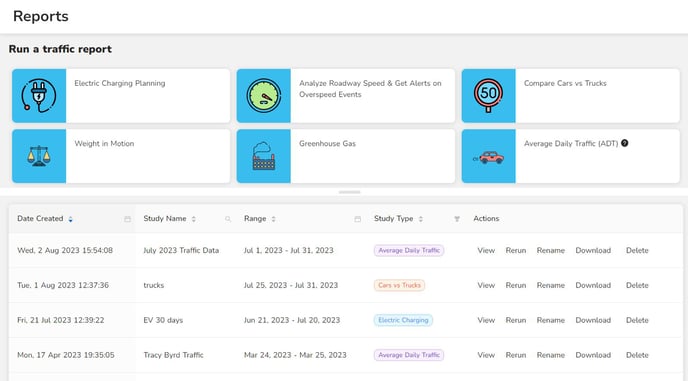
Go to Reports in the left frame.
Select the Electric Charging Planning report on the top left of the right frame.
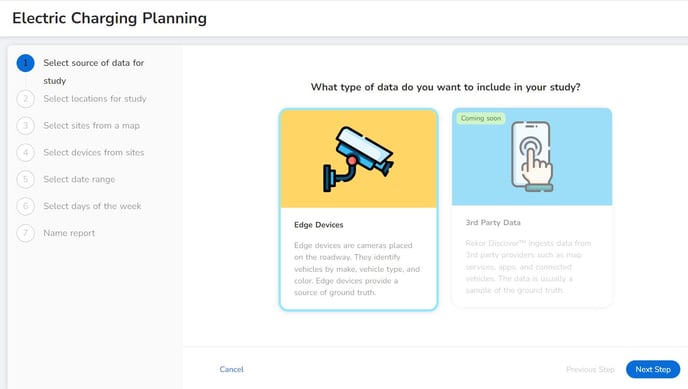
Select the source of data for the study then click Next Step.
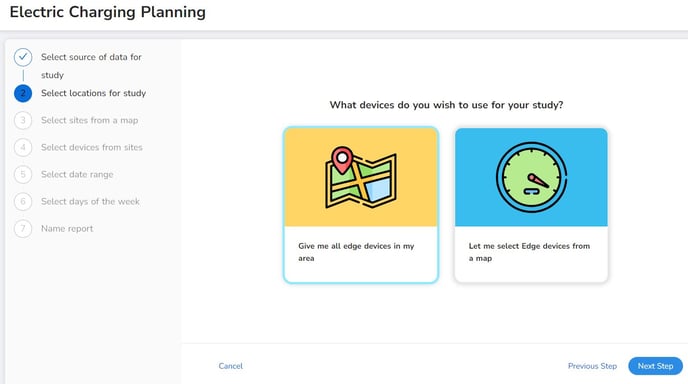
Select the Location of the devices for the study. If All Edge Devices is chosen, you will skip to entering the date range. If you choose to select Edge devices from a map, you will select those devices from a map. Click Next Step.
If you chose to select sites from a map, choose the sites then click Next Step.
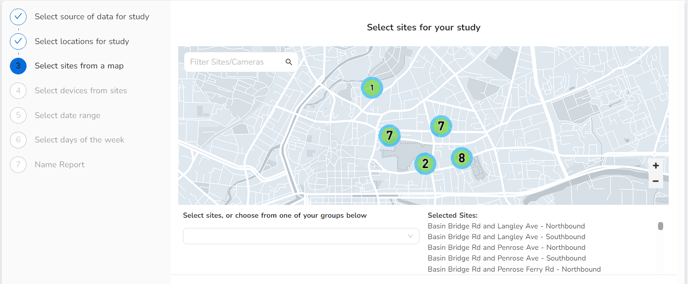
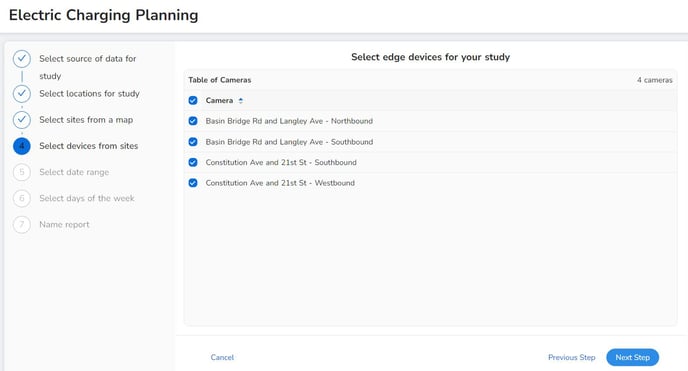
Select the devices from the list of sites then click Next Step.
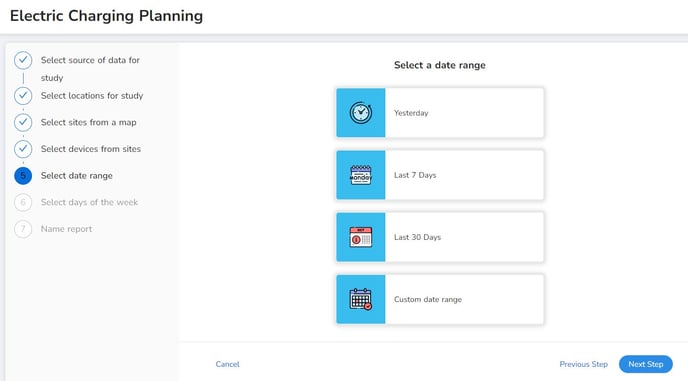
Select the date range. Choices are: Yesterday, Last 7 Days, Last 30 Days, and Custom Date Range. If a multi-day date range is selected, you will then select the days of the week. If Yesterday is selected, you will Name the Report. Make a selection and click Next Step.
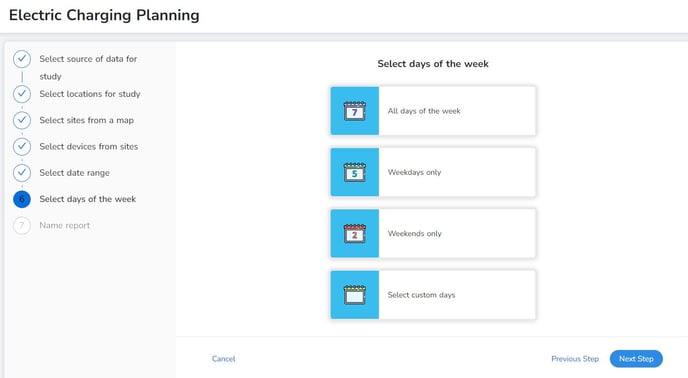
Select the Days of the Week. You may select All Days of the Week, Weekdays Only, Weekends Only, or Select Custom days. Make your selection then click Next Step.
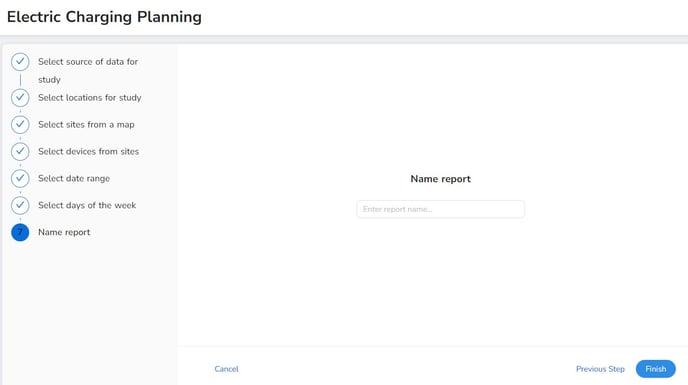
Enter the Name of the Report then click Finish.
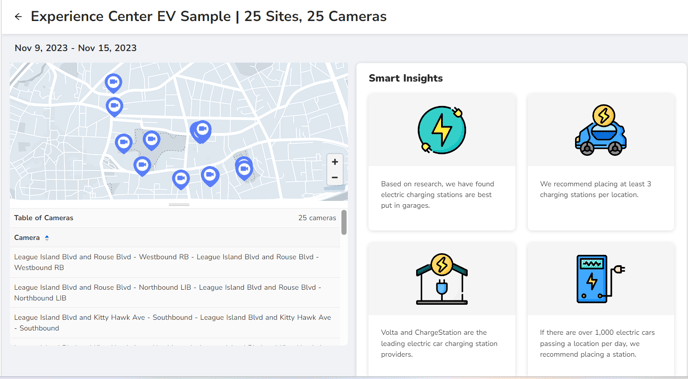
The Electric Vehicle report displays a map of the devices selected for the report, plus Smart Insights, which are tips and tricks to help the user use electric vehicle charging in better ways.
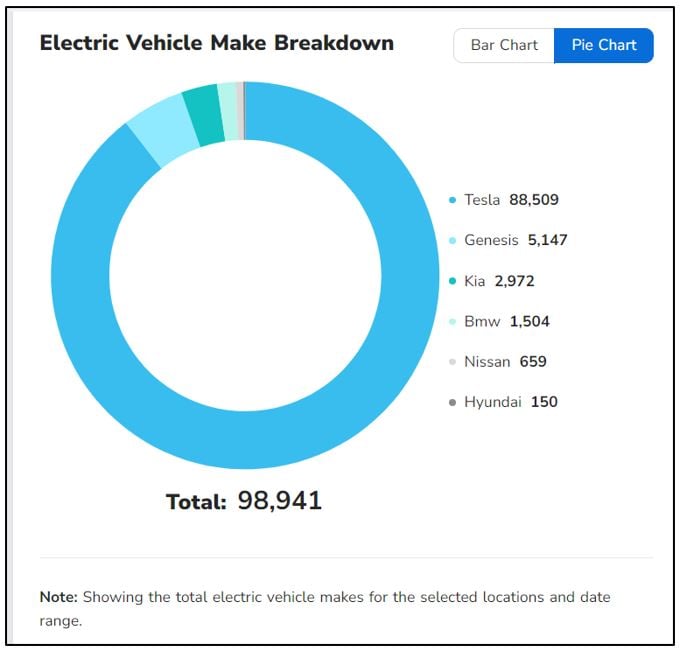
The Electric Vehicle Make graph displays the vehicle manufacturer. This data can be viewed in a bar chart or pie chart.
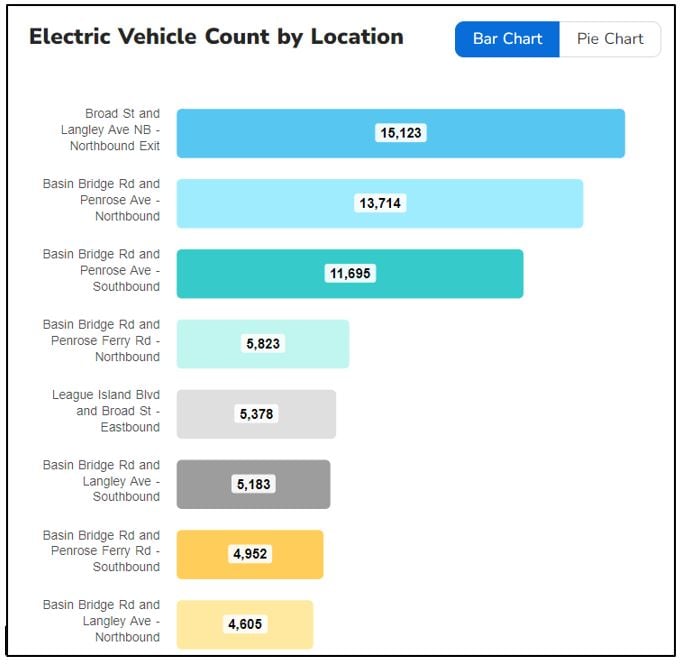
The Electric Vehicle Count by Location graph displays the count of electric vehicles per camera location. This data can be viewed in a bar chart or pie chart.
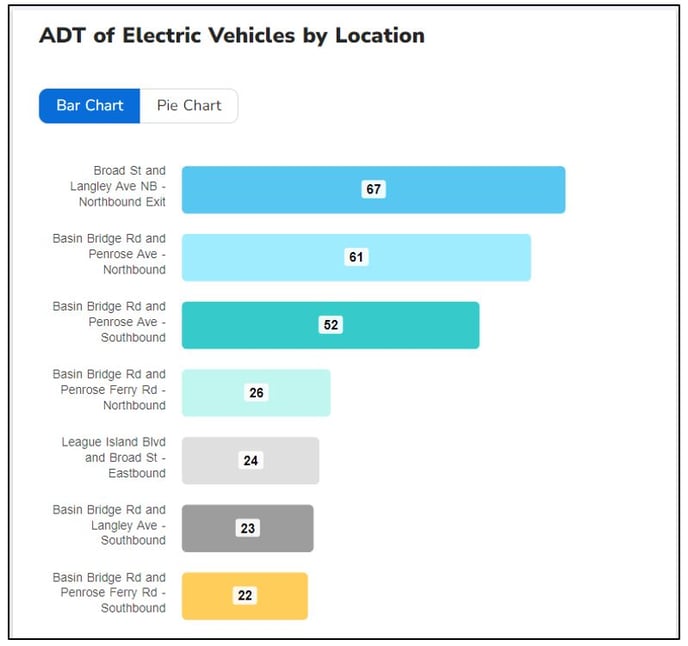
The Average Daily Traffic (ADT) of Electric Vehicles by Location graph displays the ADT count of electric vehicles per camera location. This data can be viewed in a bar chart or pie chart.